Last month I wrote about a demo of Searchmetrics Essentials, and this weekend I had the chance to get a first-hand look at the dashboard.
Essentials looks at the connection between social and search data, particularly SEO. Take the chart below, for example. This shows Social Visibility for individual blog posts from PRBreakfastClub.com. Social Visibility is defined as follows:
With a Facebook share or a Google plus-one users can vote on the quality of a site. Therefore, the aim is to motivate users to perform as many of these actions as possible. Social Visibility presents these results and prioritizes them according to the network and type of action.
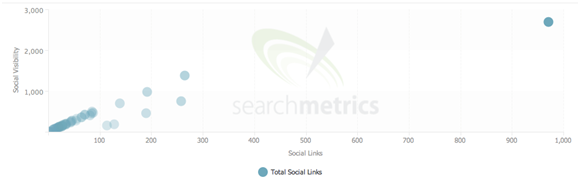
What jumps out at you right away from this chart is how much social links and social visibility are tied to one another. It’s likely you already knew this (or had a strong feeling), but it’s cool to see it visualized.
Now let’s compare to SEO Visibility for the same time period.
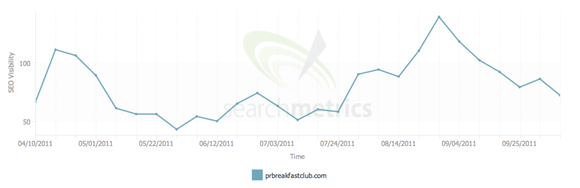
This shows SEO Visibility over time, which can help us find trends and insights when compared to Social Visibility over time (I built this one):
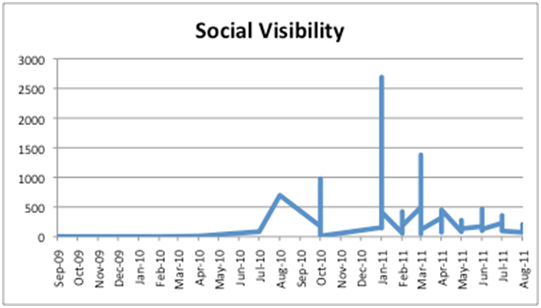
Looking at these charts side-by-side, it’s easy to see that there is definitely a connection between social and SEO visibility. As you collect more data, more detailed trends may become visible. Maybe both your social visibility changes in March, but your SEO does not. Why is that?
A few caveats to this data, though. It’s unclear how often the social data is updated as I struggled to find data that was dated after August of this year. While this tool may be best for determining overall trends and not real-time monitoring, it’s best to have the most up-to-date data to assess these trends.
It’s also tricky to visualize the SEO and social data in the same view on the dashboard, so it’s hard to make easy comparisons and find correlations. I recommend exporting the data and manipulating it yourself for the best results. (Be careful, though. It appears there is a limit to how much you can download without an additional fee.)
What insights could you learn from this data? Would you find this tool helpful?
[recent posts]